Sample plan tour
Meet Jim & Susan: A Retirement Plan Example
Jim is 58, Susan is 56. They want to spend about $82,000 a year in retirement (today’s dollars). The question this plan answers, year by year: does that work — and what happens if spending or returns change?
- $1.34M saved today across their accounts
- Retire at 62 (Jim) and 60 (Susan)
- Social Security at 62 and 60 · modeled return 6.1%
Free account · Your numbers stay private · No bank connections
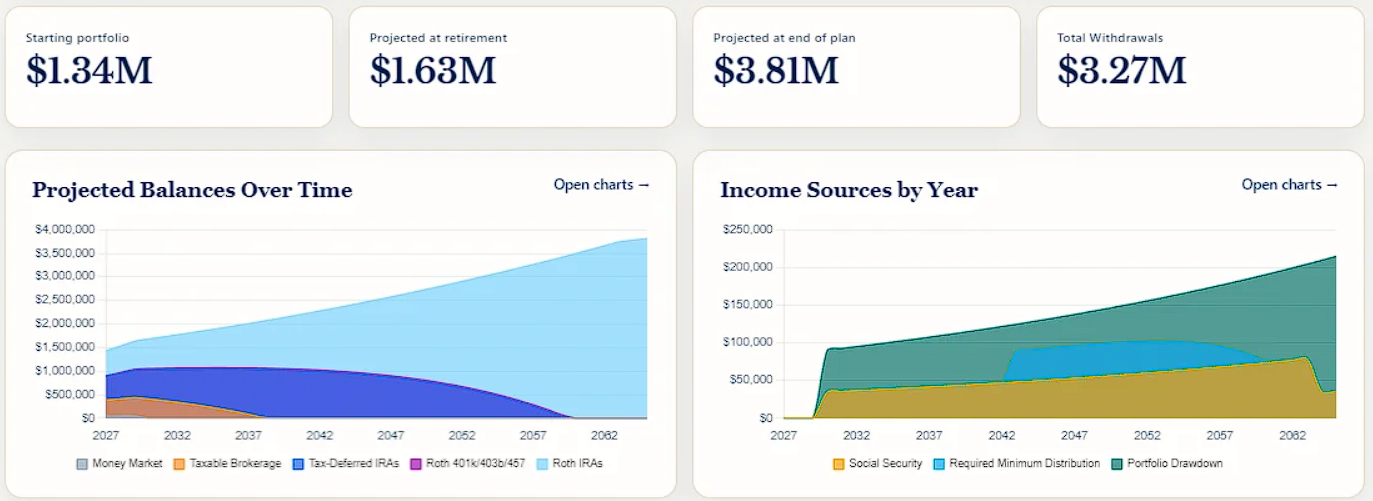
Jim & Susan’s home dashboard after baseline data is entered.
The household
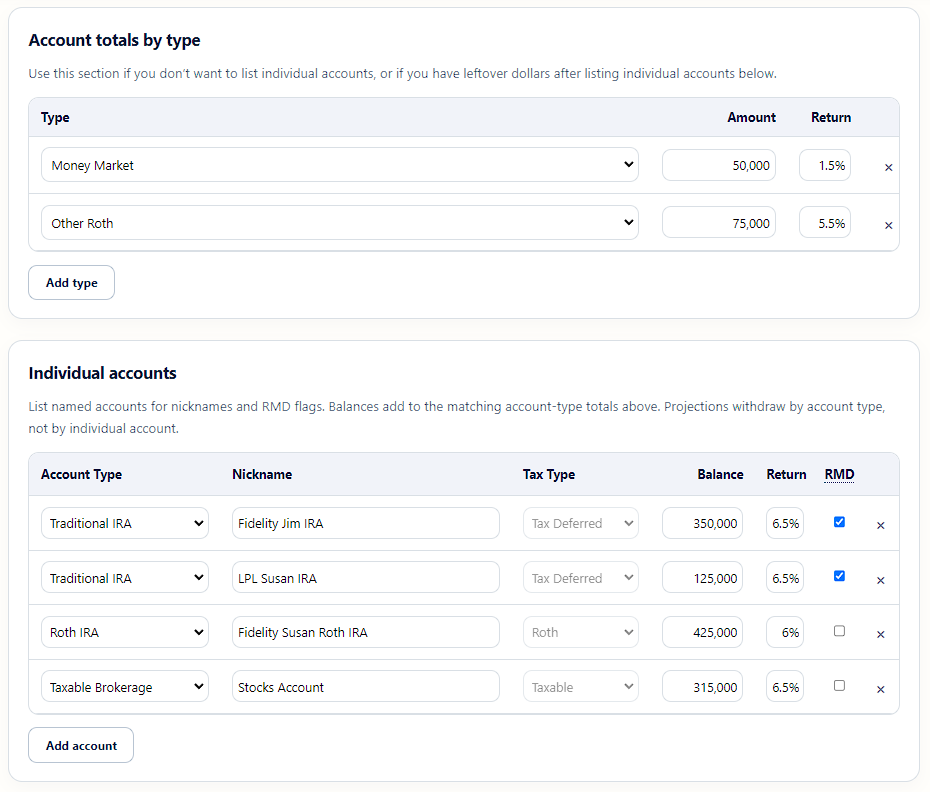
Start by documenting the savings you already have
People don’t have one generic retirement account. Savings is spread across taxable, traditional IRA, Roth IRA, annuity, pension, and other accounts. Their plan keeps those differences visible instead of combining everything into one number.
The path
See what the current plan projects
Jim & Susan plan to spend $82,000 a year during retirement, in today’s dollars. Their projection shows how their savings, retirement income, and withdrawals interact from now through the end of the plan. The projection deducts balances in an order that minimizes taxes and maximizes growth.
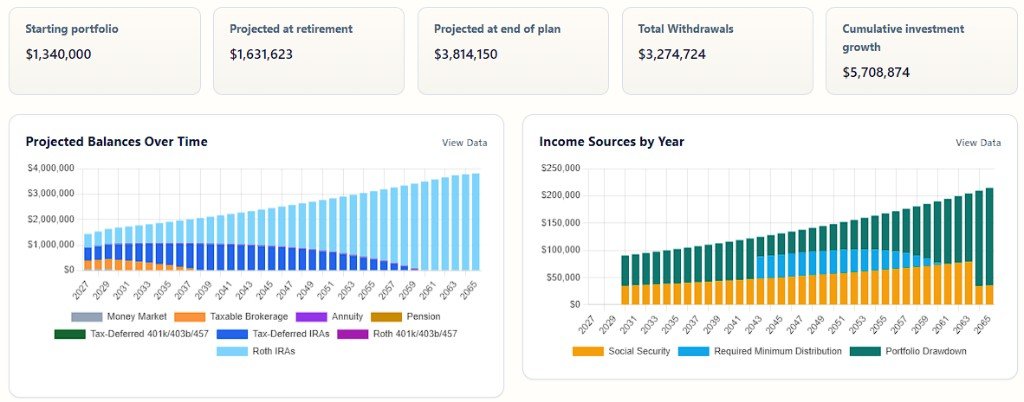
Illustrative sample data for education only — not a recommendation or guarantee of future results.
Shows its work
Follow the plan one year at a time
A retirement projection shouldn’t be a single number. Those that love the actual numbers can view every data point that influences the projection: spending, Social Security, required minimum distributions, portfolio withdrawals, retirement earnings, and the remaining balance.
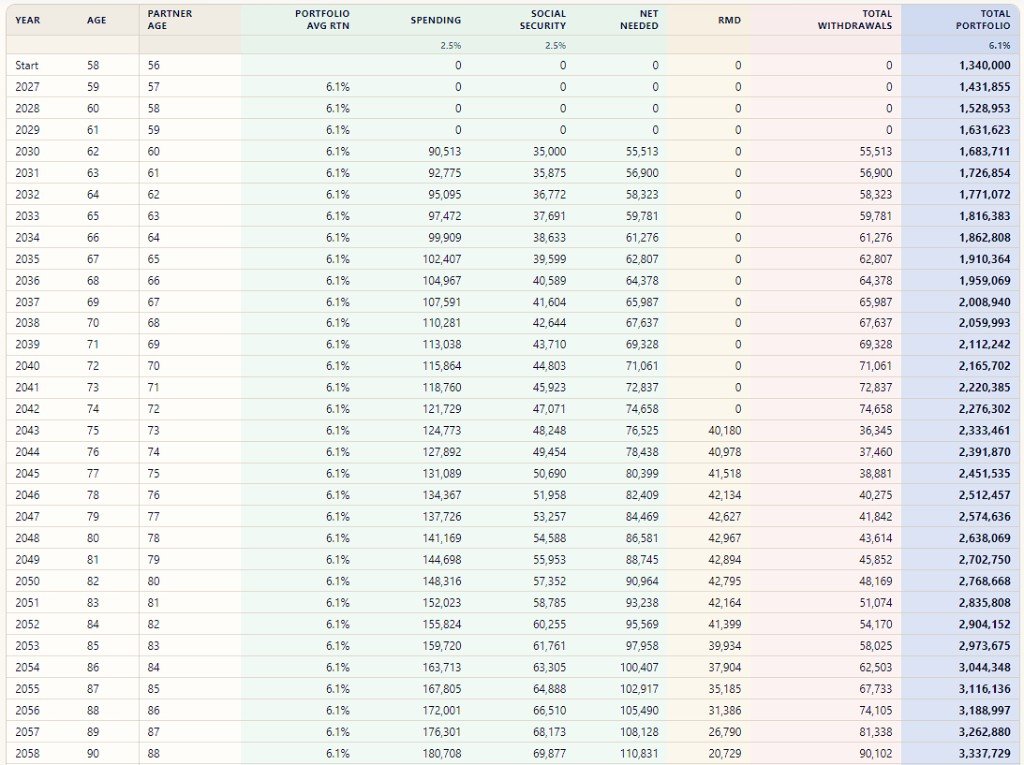
- 2030 Retirement spending begins and Social Security starts.
- 2043 RMDs begin contributing toward spending needs.
- Later years Follow how much still comes from the portfolio and how the balance changes.
What If
What happens if life doesn’t match the baseline?
What if Jim claims Social Security at 62, 65, 67, or 70? What if the market takes a wild downturn? What if they increase their retirement contributions? Explore how the results change for each variation without affecting your primary plan, and save as many variations as you like.
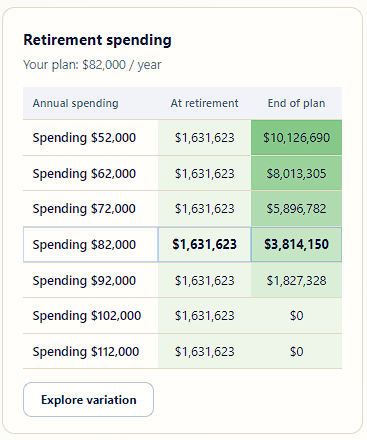
What if they spend more?
At $82,000 a year, their projected ending balance is $3.81M. Increase spending and the result changes immediately.
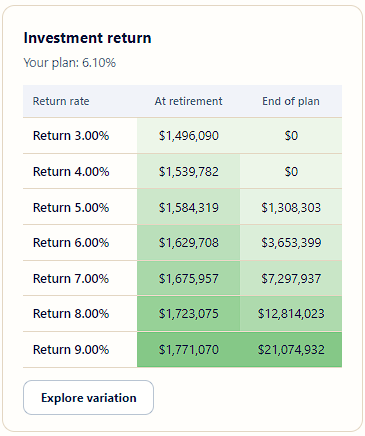
What if returns are lower?
Compare the same retirement plan across different investment-return assumptions.
Explore a decision in more detail
Compare Social Security claim ages, market paths, contributions, and more — side by side — without changing the baseline plan.
Try What If on my plan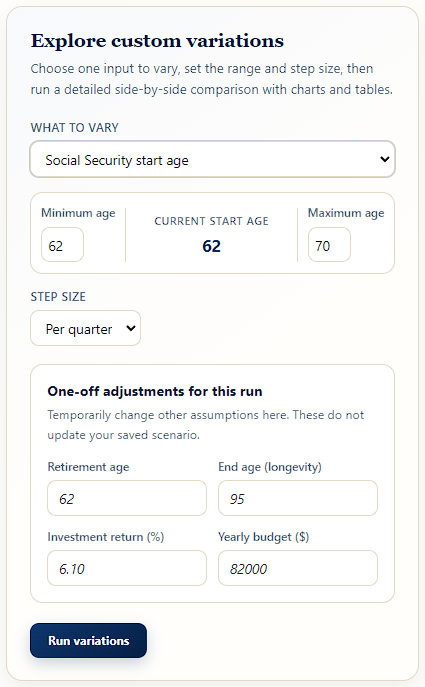
Sample figures for illustration. Your scenarios compare the same way against your baseline.
Report
Take it to the kitchen table
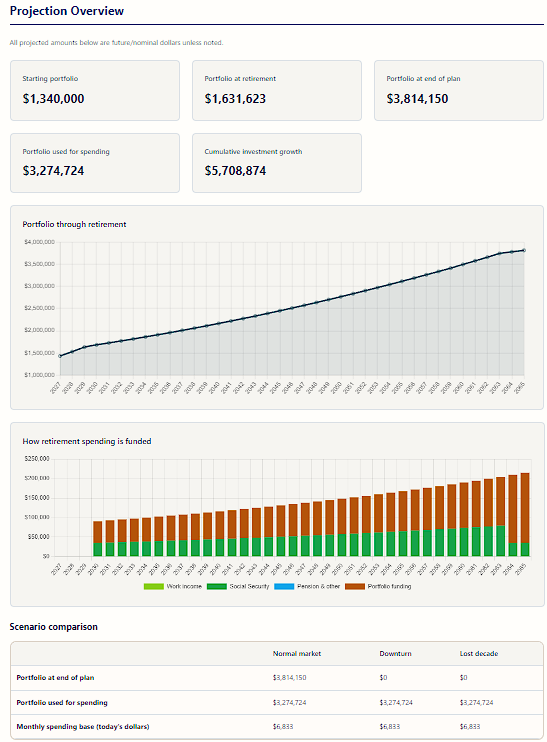
Jim & Susan can turn the projection into various reports they can review together or send to their financial planner — key numbers first, followed by the charts and comparisons that explain how the plan works. The image below is only one small part of one report.
Your turn
Four simple steps to having your own plan
-
1
Create your free account
No credit card required.
-
2
Enter Your Data
Ages, accounts, income, and spending — takes just a few minutes.
-
3
Run your projection
View results, open reports, and revisit whenever life changes.
-
4
Explore variations and “what if” scenarios
Change any input you desire, without affecting your primary projection.
This is someone else’s plan. Build yours today.
Jim & Susan are a guided example. Your free plan uses the same tools with your numbers, your assumptions, and your privacy.